Saturday, December 27, 2008

How Do Men Die in the Prime of their Lives?


My friends and I are reaching a milestone soon - a quarter century lived. Our own deaths are probably very far from our minds, and for good reason: about 2 percent of male deaths come from the 25-34 category. So while small, it is not insignificant and worth looking at.

According to the CDC in 2004 - the following are the top ten causes of death for males in the United States between the ages of 25-34.

1. Unintentional Injury - 34.8%
2. Suicide - 14.6%
3. Homicide - 13.3%
4. Heart Disease - 7.6%
5. Cancer - 6.2%
6. HIV Disease - 3.2%
7. Diabetes - 1.2 %
8. Stroke - 1.0%
9. Birth Defects - 0.8%
10. Chronic Liver Disease - 0.8%

Unsurprisingly, most of the deaths are not related to traditional disease: accidents (probably mostly automobile), suicide, and murder. This possibly suggests the need for better mental health counseling, which is an area I know very little about - including it's effectiveness and differences between nations.

What surprised me the most in these numbers is the rate of heart disease. Every year a couple of thousand in this young age group are dying of heart disease. I'm interested to know who these people are. Do they have some genetic defect that makes them especially vulnerable? Do they smoke a lot? Are they morbidly obese?

I'll break down the cancer rates in a later post, but younger males should look for cancer in the testis, the blood cancers (lymphoma), and skin cancer (melanoma).

When broadening to include females and between 25-44...


Causes of Death Number of Deaths Rate per 100,000
25-44 years All causes 148,904 177.8
1 Accidents and adverse effects 26,554 31.7
. . . Motor vehicle accidents 14,528 17.3
. . . All other accidents and adverse effects 12,026 14.4
2 Human immunodeficiency virus infection 22,795 27.2
3 Malignant neoplasms, including neoplasms of lymphatic and hematopoietic tissues 22,147 26.4
4 Diseases of heart 16,261 19.4
5 Suicide 12,536 15
6 Homicide and legal intervention 9,261 11.1
7 Chronic liver disease and cirrhosis 4,230 5.1
8 Cerebrovascular diseases 3,418 4.1
9 Diabetes mellitus2,520 3
10 Pneumonia and influenza 1,972 2.4
. . . All other causes (Residual) 27,210 32.5

You can notice the homicide and suicide rates are down, while Cancer and HIV increase. However this data is a bit older (1996), so the HIV mortality rate has gone down in recent years.
Thursday, December 18, 2008

A Look Back at my Election Predictions


House: D - 260, R - 175
Senate: D - 58, R- 40
Presidential EV: 368-170 Obama
Popular Vote: 53.6 to 45.1 Obama

Actual:
House: D - 257, R - 178
Senate: D - 57, R - 41 (assuming Franken wins)
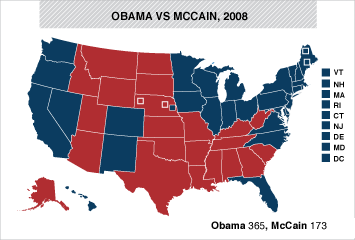
Presidential EV: 365-173 Obama
Presidential PV: 52.9 to 45.7 Obama

Not too shabby. I was correct on every state except Montana, which was closer than expected. The pollsters did a pretty good job this year with all the variables they needed to take into account: the new voters, the cell phone effect, bradley effect, and the shy tory factor among others. I thought the cell phone effect would boost Obama up a little more than it did, but I was still within about 1 percentage point. I'm sure if I had confidence intervals (which I should have), the actual results would have been within them.

In the House and Senate races the republicans did a little better than expected. With Bush's favorablity rating hovering in the low 20s, it's pretty impressive how several of his supporters held onto their house seats. It's interesting that many of those who lost were on the moderate side, leaving mostly more conservative republicans left. I think this election as a whole indicates that Change was definitely desired, but the Democrats will need to show real progress in the next 2 and 4 years if they want to keep their command.

If you're interested, check out how the "expert" pundits did on predicting election. It was probably a lot of luck, but I did better than almost all of them.

Sunday, December 14, 2008

Women Concentrate on the Wrong Organ (too)

Fear is an interesting concept that I hope to explore more in the future.

In a 2005 study by Women's Health Research, over 1000 women were asked - which disease they feared the most. I was rather surprised they found the fear of Breast Cancer more than doubled Heart Disease. While Breast Cancer caused approximately 3% of the US deaths in 2005, over 22 percent have the most fear for the disease. On the other hand, heart disease accounts for 28.6 percent of diseases and only 9.7 percent consider their top fear!! I know the US society has placed a higher emphasis of breasts over heart, but I can't say I expected this.


Fear Rank


Disease Women's Most Feared Diseases


Cause of Death in Women


Difference
1


Cancer (unspecified) 24.00%


21.60%


2.40%
2


Breast Cancer 22.10%


3.24%


18.86%
3


Heart Disease 9.70%


28.60%


-18.90%
4


HIV/AIDS 9.30%


2%


7.30%
5


Alzheimer’s Disease 4.60%


3.40%


1.20%
6


Ovarian Cancer 2.70%


1.30%


1.40%
7


Lung Cancer 2.40%


5.62%


-3.22%
8


Diabetes 2.40%


3.10%


-0.70%
9


Colon Cancer 1.60%


1.94%


-0.34%
10


Stroke 1.20%


8.00%


-6.80%


So what are the possible explanations for this?

High Incidence?

-While the mortality of breast cancer is low, there is a significant amount of women living and bravely battling the disease. On the other hand, the same can be said about heart disease.

Feeling of Control
-While risk factors such as diet, obesity, and hormones have been established, the cause for breast cancer can still be considered quite a mystery. So most women likely believe that she could develop BC and don't have the power to control it. The risk factors for heart disease - (diet, physical activity, smoking) are a bit more established, so women's feeling of control may be stronger for CHD.

Public Exposure
-Another explanation is that breast cancer has had stronger activists, fundraisers, and lobbyists that push the disease into the mainstream. The general wisdom may be that since Breast Cancer is getting the same or more ad time than Heart Disease - women's risk of death are great for BC.

*Edit*
Age of Disease
Women may believe that they are more likely to get Breast Cancer at a younger age than Heart Disease. According to SEER the median age of dianosis is 61, while the median age of death is 69. For heart disease the average age of a first heart attack is around 70 years old (though the disease can be caught at a much earlier stage).

Women still believe it's a male disease
The stereotypical person with heart disease (at least in my mind) is an overweight, red faced guy in a suit. Women only comprise of about 25 percent of heart studies, and things like this need to change.

Conclusion:
Heart disease kills about 8 times the women than Breast Cancer. The medical community needs to do a better job about expressing this risk. Maybe when people go to their primary doc, they should be asked this "what disease do you fear the most" question. Then the education can begin. Another idea is instead of counseling by doctor, people should have a "medical counclier" who discuss peoples risk of disease and what they can do for prevention. According to the Women's Heart fact sheet only 2 percent of the NIH budget is spent on prevention, and that is just flat out wrong .

2005 data from:
CDC
Women's Health Research

Women's Heart Fact Sheet

Saturday, December 13, 2008

The All-Time Greatest College Football Teams: Where are they Headed?


(rankings as of 12/3/08, click on table for larger image)

The teams highlighted blue are likely to advance in the rankings in the future, while the teams in red look like they will fall based on the last ten year win percentage, 2009 recruiting rank, and current BCS rank. Any suggestions on how to make this more scientific?

Teams with a conference championship (Big Twelve, SEC) have a slight advantage. I also give an advantage t0 two teams with nice locations (USC, Texas). Let's not kid ourselves - many good players would rather play in the sun at USC instead of frigid State College. Notice Alabama has the worst win percentage in the last ten year, but seems to be turning it around with a nice year and a quality recruiting class. Nebraska and Tennessee seemed to be failing out of the spotlight lately, and with poor performances on the field and with recruiting it will be tough to regain momentum. Notre Dame has really lost it's luster lately, and it doesn't look like Charlie Weis will be the one to bring them back.

Pretty amazing how these powerhouses just keep going. Five of the top 10 teams are going to be playing the top tier bowls.

Notes:
1. Win percentage statistics generated by stassen.
2. rankings of non-bcs teams from usa today.
3. 2009 recruiting rankings from rivals

Wednesday, December 10, 2008

Vaccines, Autism, and the Stupid Media

From the Economist:


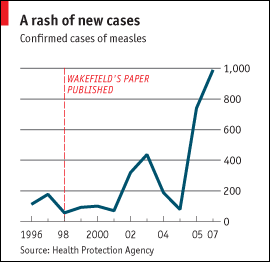
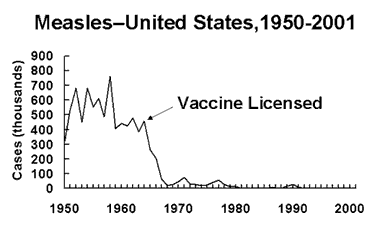
Why the sudden spike in Measles when we have a vaccine?

"The rise, says the HPA, is due to a fall in vaccination rates. In 1998 91% of two-year-olds were immunised, but by 2004 that had fallen to 80%, far below the 90% rate needed to keep the disease under control....Happily, the dip in vaccination seems to have been temporary. Immunisation rates today are 85% and rising"

Why the drop in Vaccination rate?
Thank you Dr. Wakefield....

"In the UK, the MMR vaccine was the subject of controversy after publication of a 1998 paper by Andrew Wakefield et al. reporting a study of twelve children who had autism spectrum disorders and bowel symptoms, in many cases with onset observed soon after administration of MMR vaccine.[23] During a 1998 press conference, Wakefield suggested that giving children the vaccines in three separate doses would be safer than a single injection. This suggestion was not supported by the paper, and several subsequent peer-reviewed studies have failed to show any association between the vaccine and autism.[24] Administering the vaccines in three separate doses does not reduce the chance of adverse effects, and it increases the opportunity for infection by the two diseases not immunized against first.[24][25] Health experts have criticized media reporting of the MMR-autism controversy for triggering a decline in vaccination rates.[26]
In 2004, after an investigation by The Sunday Times,[27] the interpretation section of the study, which identified a general association in time between the vaccine and autism, was formally retracted by ten of Wakefield's twelve coauthors.[28] The Centers for Disease Control,[29] the Institute of Medicine of the National Academy of Sciences,[30] the UK National Health Service[31] and the Cochrane Library review[9] have all concluded that there is no evidence of a link between the MMR vaccine and autism.
In 2007 Wakefield became the subject of a General Medical Council disciplinary hearing over allegations that his research had received funding related to litigation against MMR-vaccine manufacturers, and had concealed this fact from the editors of The Lancet.[32] It was later revealed that Wakefield received £435,643 [about $780,000] plus expenses for consulting work related to the lawsuit. This funding came from the UK legal aid fund, a fund intended to provide legal services to the poor.[27]"

It's sad what the scientifically illiterate media has done to this issue. I'm also disappointed in the political leaders like Tony Blair who would not reveal if his child was vaccinated or not. You don't mess with diseases like Measles when there is no scientific or epidemiological backup on the subject. Some random doctor speculating does not count...

Saturday, November 29, 2008

Stat of the Week: Health Care Costs

According to 2005 Paul Krugman article at the New York Times:

The following is per capita spending on Health Care

United States: $5,267 on health care/ $2,364 is government spending.
Canada: $2,931 on health care / $2,048 is government spending.
France: $2,736 on health care / $2,080 is government spending.


It's amazing how high our health care spending is. Hard to believe that our government spending on health care (medicare, medicaid, etc) is more than Canada and France's govt spending! My thoughts are that the biggest faults are the administrative costs that come with our insurance system. However I'm starting to believe that United States does not evaluate health decisions correctly, for instance over-emphasizing screening that does not extend or improve lives. More on this later, but as you can see in the following graph...yeah it's a problem.


Wednesday, November 26, 2008

US Trend in Tobacco Use and Lung Cancer Mortality

A question was proposed in the comments of the previous entry - how has smoking rate changed after the GIs had been given cigarettes in their rations during World War 2 (early 1940s).

The following graphic displays this trend well. It also shows the lag in time of tobacco use to lung cancer mortality. It's nice to see both the cigarrette consumption and lung cancer mortality decreasing, but sadly this is not true in developing asian and african countries where ciagrette use is becoming very common.


Source: ACS 2008 Cancer Statistics Presentation

The graphic below displays the amount of different cancer deaths that can be attributed to smoking. Lung cancer greatly outranks the rest of the cancers, with an attribute rate of 80-90 percent. However only 20 percent or so of smokers end up with lung cancer, due to other risk factors such as genetics, amount smoked, etc.

Source: ACS Cancer Facts and Figures

Tuesday, November 25, 2008

Top Cancers in the United States

Here are the most popular figures in general cancer epidemiology - a flavor of things to come for this blog. Please share ideas on what to show in the future.

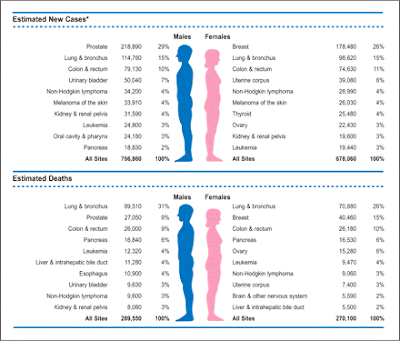
Notice how deadly Lung, Pancreas , and Leukemia - comparing their incidence and mortality rates. It's interesting how little you hear about Pancreas, Ovary, etc - it's probably because the 5 years survival is so low that there is much less pressure to lobby for these diseases. Overall Men have a 1 in 2 chance of developing cancer in their lifetime, while Women have a 1 in 3 chance.


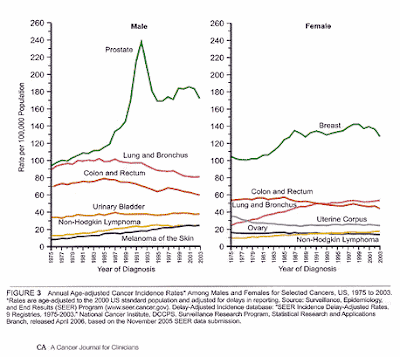
The jump in prostate cancer in the early 90s is due the PSA screening coming into the mainstream. PSA screening is still controversial today - it has not been proven to extend/save lives as of yet. With prostate cancer's five year survival rate of 99 percent, epidemiologists are asking: should we put putting men through this?
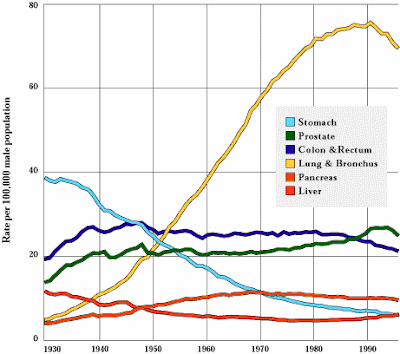
Male death rates over time - notice how lung how over-trumped them all due to tobacco use. The disappearance of stomach cancer is still a bit mysterious.


Lung cancer has recently become the number 1 killer for females, due to a later development of tobacco use. Breast and colon cancer, which diet is a major risk factor, are well ahead of the rest of the cancers


Friday, November 14, 2008

Stat of the Week: Tobacco Deaths

"But if global adult smoking prevalence declines to 20% by 2020, at least 100 million fewer people currently alive will be killed prematurely by tobacco."

How to prevent 100 million deaths from tobacco
Thomas R Frieden, Michael R Bloomberg

Wednesday, November 5, 2008

Monday, November 3, 2008

Election Predictions

DataDrivenDecision's Predictions

Electoral College:
  • 368 Obama Electoral Votes
  • 170 McCain Electoral Votes
  • (Obama takes Kerry States + IA, NM, CO, VA, NV, OH, FL, NC, MT, IN, and NE-2)

Popular Vote:
  • 53.6 Obama Popular Vote Percentage
  • 45.1 McCain Popular Vote Percentage

Senate:
  • 58 Democratic Senate seats
  • 40 Republican Senate seats
- Top Senate races (my prediction):
1. Minnesota (D) - closest race
2. Georgia (D)
3. North Carolina (D)
4. Kentucky (R)
5. Alaska (D)
6. Oregon (D)
7. New Hampshire (D)
8. Mississippi (R)
9. Colorado (D)
10. Nebraska (R)

House:
  • 260 Democratic House seats
  • 175 Republican House seats

Overall Commentary:
-This prediction is pretty optimistic for the Dems, but I believe the polls are currently underestimating Obama and Dem support due to the cell phone effect and the difference in "ground games". If McCain wins - the polls will have made a historic miscalculation, which the general consensus being Obama +7.
-A few reasons for a McCain underestimation would be a poor response rate for polls (phone polls ~20% which could miss unenthusiastic republican voters who will still show up to the polls - or the Shy Tory Factor), overestimating of youth vote, and possibly the Bradley effect in a few states.

What to watch for:
1. See Nate Silver's column in Newsweek for presidential race
2. Will the Dems get 58 seats in the senate (60 seat filibusterer with Is)? - Watch Ga, Ky, and Mn if it's close
-How many house seats will the Dems pick up? See my prediction above, but I'll be watching MD-01, CT-04, MN-06, AZ-04, CA-04, AK-Al, FL-21, Fl-25, MO-08, WA-09, PA-03, PA-12, SC-01, and WY-AL.

Thursday, October 30, 2008

Stat of the Week: Life Expectancies in Baltimore


"In West Baltimore's impoverished Hollins Market neighborhood, where the average life expectancy is about 63 years...Across town in wealthy Roland Park, where residents live on average to be 83"

It's crazy how great the dispairites are between two locations within a few miles of each other. Infant mortality and violence are probably the biggest contributors to this difference.

Wednesday, October 29, 2008

Abortion

Like the author of this article I believe abortion should be considered a public health problem.

The hypothesis is based on this research paper in the journal international family planning perspectives which comes to this conclusion:

Abortion rates are no lower overall in areas where abortion is generally restricted by law (and where many abortions are performed under unsafe conditions) than in areas where abortion is legally permitted.

The evidence is there to make the correct public health decision - but instead of promoting sex education and other social measures, the United States wastes their time with whole roe vs. wade (life/choice) argument. I feel both sides of the aisle are looking at this problem in the wrong way - we can have life and choice, but we're too blind to see it.

I can't say I'm a huge fan of that research paper and there are probably some flaws in it. However the issue is - why aren't we talking about roe v. wade instead of just saving lives?

Other people are a lot more passionate about this issue than I am, so maybe someone can enlighten me.

Thursday, October 23, 2008

Evolution and Science in America

Via 2006 National Geographic article:
(blue = believes in evolution, red doesn't)


Selected Quotes:
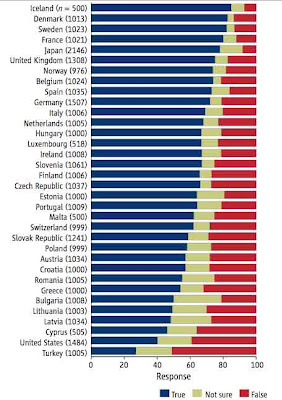
-"In the U.S., only 14 percent of adults thought that evolution was "definitely true," while about a third firmly rejected the idea. "
-"The researchers cite a 2005 study finding that 78 percent of adults agreed that plants and animals had evolved from other organisms. In the same study, 62 percent also believed that God created humans without any evolutionary development."
-"Fewer than half of American adults can provide a minimal definition of DNA, the authors add. "
My thoughts:
-We need to teach and emphasize genetics much earlier in school (elementary). You can make better inferences about a wide range of topics - history, science, even English when you understand genetics.
-Since a majority of Americans are now required to go to college - all students, particularly liberal arts majors should be required to take some type of biology/genetics class. We need to avoid the hubris of humanities (NYT).
-Get more scientists in public office. According to the above NYT article, there were 218 lawyers, 12 doctors, and 3 biologists in congress in 2005. When 90 percent of our representatives probably have a weak science background, we're probably going to fall behind. See the recent examples of stem cells, climate change, research funding, and bioethics.

Wednesday, October 22, 2008

Stat of the Week

Johns Hopkins study - number of deaths in Iraq

  • Estimated 654,965 additional deaths in Iraq between March 2003 and July 2006

Now over 1 million?

Tuesday, October 21, 2008

Income Distribution

A nice graphic from the economist:

A few things that stand out to me:
-The United States seems the most positively skewed - mean is much greater than the median (5th line)
-There is a significant proportion in the US in the lowest decile compared with other developed countries - Canada, Britain, France...
-US has largest top decile by a fair margin

It would be interesting to see this over statistic over time. I'm guessing that our country has always had a larger range than the other countries. I think it's pretty fair to think that this was constantly changing (under every presidential administration).

Friday, October 17, 2008

What is up with Michigan?

I am bit biased against Michigan because of one of their football teams currently holds a 9 game winning streak against my alma mater (which will hopefully be broken tomorrow).

However, I found this story which we discussed in class especially odd:

The NYT described it like this: "1,000 people who attended a ''rave'' in Michigan and allegedly shared a pacifier dipped in the drug Ecstasy were urged to see a doctor after meningitis was diagnosed in one of them."

-Not only is the pacifier part a bit weird, but supposiedly these teens attended this rave in the middle of a corn field. Really a cornfield?!

Stat of the Week

According to the New Yorker:

"By far the biggest theft problem faced by retailers, however, is employee theft, which accounts for nearly 47% of profit erosion."

(from a 2005 Florida Study - companies lost 1.61 percent of sales to theft or fraud)

I am naive about this subject, but I feel it would be more cost effective on preventing this rather than shoplifters (who make up 33 percent of this sample). You have to consider the negative consequences of attempting to prevent customers from shoplifting like false positives (angry customers leading to lost businness, lawsuits/punitive damges). An earlier version of the study states: "While the average shoplifting incident costs the retailer $212.68, an employee theft averages $1,058.20 per incident."

Thoughts:
Investigate Employee Crime more
Replace employees with self-check out machines/robots in the future?

Friday, October 10, 2008

Election Thoughts


- Obama's is about 6 to 7 points up depending on which national tracker you look at. I consider polls have a margin of error of about 4 to 5 points, so Obama is looking pretty good now. That being said there are several reasons that election night will still be interesting.
1. McCain makes national gains in the next 3+ weeks. There are many different scenarios in which this is possible considering where the race was 2 weeks ago. I think Democrats are bit too over confident right now, if that's possible. Assuming McCain does come back there could be some crazy scenarios that I'd like to highlight.

A) Electoral Tie of 269/269. This scenario looked quite possible 2 weeks ago. Obama would have to win all Kerry State except New Hampshire (currently +5.3 obama), and McCain would have to win all Bush States except Colorado (+4.6 obama), Iowa (+10.7 obama), and New Mexico (+6.2 obama) for this to happen. With the recent Obama surge in Ohio, Florida, and Virgina - this doesn't look likely (Sliver has it at a 0.16 probablity). However if McCain made national gains, it does seem possible.

Check out the link above for more, but it looks like it would go to the newly elected house for a vote, and then a senate if as the tiebreaker. One would think this would favor the democrats - but things like popular vote, voter recounts ala florida 2000 (that would be decided by conservative supreme court), need to be taken into account.

B) Maine and Nebraska actually allocate their electoral votes by congressional district
Maine is +7.5 Obama, only 1 point above the national average. The districts in Maine vote approxamiately the same though, so McCain may want to pick one and see if he can turn it red. Nebraska is a deep red state, but has a moderate district that includes Omaha, that Obama could turn blue (but only if it's a blowout - less likely to break a 269-268 ties).

C) Election day surprises?
If it is a good day for McCain - Minnesota and Iowa. These are actually the only two "swing" states that McCain has spent more campaign money than Obama in. Democrats currently believe he's wasting his money, but if McCain mangies to surprise these could be the ones.

If it is a good day for Obama - Indiana, West Virgina, North Carolina, and Georgia. If Obama wins any of these states it will likely be a blow out. Obama's "ground game" has gotten rave reviews, so suprises could happen on these relatively red states because of several different demographic factors.

2. In case of Obama Blowout - Senate races

If Obama wins easily, the analysts will be staying up late on election night trying to figure out if the democrats are able to get a 60 seat filibuster proof majority in the senate. If this happens, it is much more likely that Obama's proposed policies will come to fruition.

Nate Silver currently projects the odds of a 60 seat majority at about 25 percent (see below). The 7 interesting states to watch will be Oregon, Minnesota, North Carolina, Georgia, Kentucky, Mississippi, and Alaska. If results are less favorable for democrats, Colorado and New Hampshire should be a tight race. Basically the Dems need to turn 9 currently republican held senate seats to turn blue. 4 currently look like they are close to a lock, then Dems need 5 of those 7 states I mentioned above for the 60 seat majority. It looks doubtful, but possible.

Wednesday, October 8, 2008

Fat Asians

Obesity is a huge emerging problem that I talked about last month. The most common measurement is BMI, which is flawed in many ways. BMI or Body Mass Index measures your weight compared to your height. It does not take into account muscle or particularly kind of fat (healthly or non-healthly). Muscular men seem to be considered overweight (>25 kg/m^2) or obese (>30 kg/m^2) even appearing very fit and having very low % body fat.

Muscular men are not the only ones mischaracterized by this measure; a 2004 Paper from the Lancet suggests that Asians are at greater risk of obesity related diseases (cardiovascular disease, diabetes) at lower BMIs than Caucasians. Asians appear to have increased subcutaneous and upper body fat that is not captured by the BMIs. These fat measurements can be captured in other ways like body fat percentage....


a study in new york measured the following:
Body Fat % at BMI of 25 kg/m^2
Males: Whites: 19.2, Asians: 23.6
Females: Whites: 34.2 Asians: 36.8

Based on the these finding in others the WHO recommended (pdf) the following:

"For many Asian populations, additional trigger points for
public health action were identified as 23 kg/m2 or higher,
representing increased risk, and 27·5 kg/m2 or higher as
representing high risk. The suggested categories are as
follows: less than 18·5 kg/m2 underweight; 18·5–23 kg/m2
increasing but acceptable risk; 23–27·5 kg/m2 increased
risk; and 27·5 kg/m2 or higher high risk."
To summarize/oversimplify, an overweight Caucasian has a BMI over 25, while an overweight Asian has a BMI over 23. No worries my deceivingly chubby Asian friends, the WHO also mentions that the overweight cutoff varies by Asian population from 22-25. My suggestion for those of all races is to get your body fat percentage measured along with your waist/hip ratio - assuming you need more motivation to eat healthy and exercise (or if you just like numbers). Hopefully in the future the health community can improve on the BMI measure and use a less archaic measurement that is less misleading.

Friday, October 3, 2008

Polling Cell Phones - Missing Obama Votes?

There is an emerging challenge for pollsters in the 2008 election - polling cell phone users.

Cell phone only users are usually those under 30, a group that has been strongly supporting Barack Obama. For their samples most pollsters use a random digit dialer that call only landlines. Therefore they are missing a lot of younger voters in their polling. To make up for this most (respectable) pollsters stratify their sample, making sure they get enough voters in each subgroup including young voters (<30).

The assumption being made with this stratified studies is that the landline user group adequately represents the whole population of cell phone users. Pew Research group recently looked into this problem and found some interesting results...


More specifically.....
"Combining polls it conducted in August and September, Pew found that of people under age 30 with only cell phones, 62 percent were Democrats and 28 percent Republicans. Among landline users the same age, that gap was narrower: 54 percent Democrats, 36 percent GOP.
Similarly, young cell users preferred Democratic presidential candidate Barack Obama over Republican nominee John McCain by 35 percentage points. For young landline users, it was a smaller 13-point Obama edge."
-Baltimore Sun

What could the reason be for this difference? Possibly, cell phone only users are those living in cities and more technologically enabled - two groups that seem to go strong for Obama. In epidemiology speak, age is an effect modifier in this election, and it appears Pew believes "cell phone only use" is a confounder. Nate Silver mentions "Urban voters are about 50 percent more likely to be cellphone-only than rural voters, for instance, and while some pollsters weight by geography, others do not. Thus, you may wind up with a biased sample." So this leads to the possibility that other polling outfits are slightly (unintentionally?) biased towards McCain.

So what can we infer from this?
(Assumptions)
1. Pollsters are using data from the group of young landline users, who are currently +13 Obama.
2. They are inadvertently excluding from the group that is +35 Obama
3. I have seen data stating about 50 percent or more of adults under 30 are cell phone only users (though less likely to vote than their counterparts).
4. Pollsters weigh younger voters under 30, as about 20 percent of the sample.

So according to Pew, pollsters are inputing the +13 Obama data, when they should be inputing +24 Obama data. Assuming that this data is worth 20 percent of the sample, that equals to a 2.2 percent difference in Obama's favor.

Conclusion:
-Polls appear to be under polling Obama by a percentage point or two (estimated 2.2 points) based on this variable alone.

Update:
I'm not sure how I missed this. It's a good summary of what polls use cell phone data. Nate comes up with a similar value +2.8 Obama comapring two sets of data.

Tuesday, September 30, 2008

700 billion dollars

Understanding the United States financial woes is a rather difficult task. I'm still trying to get a handle of it myself. My basic thoughts are that we have been accumulating debt and deregulating the markets for several decades now, and it's finally come back to bite us. Corporations job is to turn a profit, it's the government job to regulate and protect the general public. The government has failed us in this instance.

That being said, this article from daily kos does a nice job explaining why a plan is needed, explaining the financial institutions as the heart of the economy.

As you know, the bailout/rescue bill failed yesterday, leading to a major drop in the stock markets around the world. The congressmen (particularly ones up for re-election) have a very difficult decision to make. There have been rumors that calls were made to the congressmen by the general public being 50 or 100 to 1 against the bailout/rescue bill. However you can notice from the markets some kind of bill is essential. I think it's important to remember that this 700 billion isn't all going down the drain, but an investment that could actually make money one day (a risky and possibly bad one though).

It is understandable that tax payers are against with figures like the one in Time Magazine showing how much 700,000,000,000 really is...

  • Give every person in the United States $2,300 or give every household $6,200
  • Pay the Income taxes of every American who makes $500,000 or less a year
  • Fully fund the Defense, Treasury, Education, State, Veterans Affairs and Interior departments next year, as well as NASA
  • Buy gasoline for every car in the United States for the next 16 months.
  • You could pay the income taxes for every American who makes $500,000 or less.
  • You could buy every NFL, NBA, Major League Baseball team and build each one a new stadium - and pay every player $191 million each for a year.
  • Create the 17th largest economy in the world - roughly equal to that of the Netherlands
  • You could pay off just 7% of the $9.8 trillion national debt

Monday, September 29, 2008

Cell Phones and Brain Cancer


Figure 1.
Estimation of the penetration of electromagnetic radiation from a cell phone based on age (Frequency GSM 900 Mhz) (On the right, a scale showing the Specific Absorption Rate at different depths, in W/kg) [ ]
Today I saw Devra Davis lecture about her new book, The Secret History of the War on Cancer. In the book she discusses the controversial topic of Cell Phones and Brain Cancer comparing it to the Tobacco/Lung Cancer relationship back in the 50s.

Her main points were:
-We don't have enough evidence to make conclusions one way or another
-Previous studies (which mostly have shown no association) have been biased, cell phone users included anyone who made in a call in the past 6 months
-Huge increase in use has only happened in past ten years, cancer takes 20-30 years to develop.
-Particularly concerned about children's increased use of cell phones, since skulls are thinner and brains aren't not fully myelinated. (see above figure)
----------
This NY Times article provides a more balanced view:

"According to the Food and Drug Administration, three large epidemiology studies since 2000 have shown no harmful effects. CTIA — the Wireless Association, the leading industry trade group, said in a statement, “The overwhelming majority of studies that have been published in scientific journals around the globe show that wireless phones do not pose a health risk."

The F.D.A. notes, however, that the average period of phone use in the studies it cites was about three years, so the research doesn’t answer questions about long-term exposures. Critics say many studies are flawed for that reason, and also because they do not distinguish between casual and heavy use.

Cellphones emit non-ionizing radiation, waves of energy that are too weak to break chemical bonds or to set off the DNA damage known to cause cancer. There is no known biological mechanism to explain how non-ionizing radiation might lead to cancer."
-----------
Studies that have shown risk have unalarming low Odds Ratios:

Meta-analysis of long-term mobile phone use and the association with brain tumours


Abstract:
We evaluated long-term use of mobile phones and the risk for brain tumours in case-control studies published so far on this issue. We identified ten studies on glioma and meta-analysis yielded OR = 0.9, 95% CI = 0.8-1.1. Latency period of ≥10-years gave OR = 1.2, 95% CI = 0.8-1.9 based on six studies, for ipsilateral use (same side as tumour) OR = 2.0, 95% CI = 1.2-3.4 (four studies), but contralateral use did not increase the risk significantly, OR = 1.1, 95% CI = 0.6-2.0. Meta-analysis of nine studies on acoustic neuroma gave OR = 0.9, 95% CI = 0.7-1.1 increasing to OR = 1.3, 95% CI = 0.6-2.8 using ≥10-years latency period (four studies). Ipsilateral use gave OR = 2.4, 95% CI = 1.1-5.3 and contra-lateral OR = 1.2, 95% CI = 0.7-2.2 in the ≥10-years latency period group (three studies). Seven studies gave results for meningioma yielding overall OR = 0.8, 95% CI = 0.7-0.99. Using ≥10-years latency period OR = 1.3, 95% CI = 0.9-1.8 was calculated (four studies) increasing to OR = 1.7, 95% CI = 0.99-3.1 for ipsilateral use and OR = 1.0, 95% CI = 0.3-3.1 for contralateral use (two studies). We conclude that this meta-analysis gave a consistent pattern of an association between mobile phone use and ipsilateral glioma and acoustic neuroma using ≥10-years latency period.
-----------------


My Conclusions:
1. Chances are there is little or no risk increase for general population, but even a small risk increase would be a big public health problem since billions of people use cell phones.
2. The lack of known biological mechanism is huge and the major reason the FDA and scientists aren't freaking out
3. Studies should be particularly concentrated on children

4. Time will tell, hopefully we can gather more evidence and not be slow to action like with tobacco (if there happens to be causational evidence).
5. If worse comes to worse, we can always go back to the Banana Phone...

Sunday, September 28, 2008

Phillies Clinch NL East!


My friends and I went to a classic Phillies game on Saturday, that statistics can not adequately describe. The figure above is from a cool website called fangraphs.com. It's able to track the win probability as the game goes on. It also measures the "leverage index (LI)" or importance of each at bat as the game goes along. You can notice a big dip in probability and increase in leverage with a "C Guzman Single". That single made the game 4-3 and loaded the bases with only one out. The graph can't fails to illustrate the next play which appeared to be a lead changing single, but was turned into a game ending double play.

There are also some pretty cool statistics measured on this site including WPA (Win Probablitiy Added), and Clutch.

Since I know you're interested, rankings of a few players in WPA for the 2008 season:
1. Manny Ramerez: 7.03
2. Lance Berkman: 6.68
3. Albert Pujols: 6.22
8. Carlos Beltran: 4.53
9. Joe Mauer: 4.52 (top in AL)
11. Pat Burrell: 3.78 (top for phillies)
39. Jason Giambi: 2.17 (yes he was ranked above Howard)
40. Ryan Howard: 2.17 (NL MVP or MVP of the month? - he leads in September WPA)
50. Jack Cust: 1.85 (sadly, the top athletic)
148 (last). Jeff Francoeur: -3.91

Tops in "clutch" (WPA/(LI-(WPA/LI))):

1. Stephan Drew: 2.29
2. Lance Berkman: 1.82
3. Dustin Pedroia: 1.52
8. Pat Burrell: 1.15 (top for phillies)
115. Ryan Howard: -0.76
145 (4th to last): Chase Utley: -2.11 (I don't think phillies fans noticed)
148 (last): Alex Rodriguez: -3.09 (ny fans might have been right this year?)

And FYI for pitchers WPA:
WPA: Starters
Cliff Lee6.22
Tim Lincecum4.73
CC Sabathia4.69
Roy Halladay4.48
Johan Santana4.41
WPA: Relievers
Brad Lidge5.43
Mariano Rivera4.47
Joakim Soria4.42
Joe Nathan3.73
Carlos Marmol3.71
(Hamels is 15th for starters)

Tuesday, September 23, 2008

2008 Election: State Rankings - 9/23/08

(Rank, State, Score (max=1))
1. Pennsylvania - .854
2. Michigan - .775
3. Florida - .685
4. Minnesota - .675
5. Colorado - .652
6. Wisconsin - .620
7. Washington - .589
8. New Jersey - .583
9. Ohio - .576
10. Virgina -.560

-----
Just Missed: North Carolina, New Mexico, Indiana, Oregon, Nevada
(2000 Florida would rank 1st, 2004 Ohio would rank 2nd just below Pennsylvania)

See my intro - for the explanation of the question and methods for this project.
Current National Average: +3.0 for Obama
Nate Sliver's top 5 tipping point states: Pennsylvania, Ohio, Virgina, Colorado, and Michigan

Analysis:
The states at the top seem to be more Obama leaning states possibly because of a recent Obama bump in the national polls. It's possible that some of the state data has yet to catchup with the national data. The list is filled with larger states possibly to a fault. I'm considering changing the 50/50 designation. I'd love to hear feedback.

A couple of surprises on the list:
1. Pennsylvania - seemed to be a strong obama state, but polls have been mixed lately, very close to national average
8. New Jersey - see Pa
9 and 10. Ohio and Virgina - would expect to see these states at the top of the list. Seem to be running a few points behind national average for Obama.

Monday, September 22, 2008

2008 Election: State Rankings - Intro

As we are under two months away from the Nov 4th election and a few days away from the first debate, I thought I would take a try at some statistical predictions.

Question: What state is most likely to be this years Florida (2000) or Ohio (2004)? Which one will be the "tipping point" state that decides a very close election. Several sites such as 538 have similar analyses but seem overly convoluted attempting to adjust for all confounders that are difficult to measure. I will provide a crude analysis that could be less biased than the other on the web. (I prefer the 538 one, but it is nice to having something to compare it too)

-----------
Methods:
The rankings are based off of two measures:

1. States Difference from National Average
based on composites from Pollster (a popular ranking which combines all data from several pollsters - gallup, rasmussen, cnn, etc). I excluded a state more than 10 points away from national average, assuming they would not be a tipping state. We are also assuming that the election will be closely contested in terms of popular vote, or there will not be a tipping point state.

=(10-X)/10
X=State's difference from national average
*therefore a state that is exactly equal to natural average = 1*
-given .50 weight

2. # of Electoral Votes - (538 total in nation, 270 needed to be elected president)

=(State X's # of Electoral Votes)/(Largest State of Interest Electoral Votes)
*therefore Largest state in question ratio = 1*
-given .50 weight (In 2004 - New Mexico and Iowa were actually closer contested than Ohio, but did not have enough EV to "tip" the election)
-------------

Assumptions/Drawbacks:
-State data is following same trend as National data (not lagging behind)
-Confounders such as ground game, similarities to other swing states (demographics), and nation/state lag time are not involved in model
-Arbitrary weighting of state average (.5) , electoral average (.5)